
データの視覚化
プログラミングでのグラフィック描画の役割の1つに「データの視覚化」があります。一般的に「インフォグラフィック」と呼ばれるものですが、プログラミングをうまく使えばインタラクティブなインフォグラフィックを作ることも可能になります。次の例を見ていきましょう。
Radiation & Food Map in Japan
福島第一原発事故後から現在に至るまでの日本中の食品中放射性物質検査の結果をインタラクティブマップにしたもの。自身のプロジェクトです。
パスケットボールチームのゴール前でのシュートポイントを視覚化したグラフィック
ニュースマップ。Googleニュースの各国における記事のカテゴリーを分類し、可視化したもの。
オバマ政権における2013年の国家予算提案の内訳
アメリカの失業率の視覚化
中東における反政府運動の歴史
イギリスのエネルギー消費
視覚化の様々な実験的サイトが掲載されている。
http://infosthetics.com/
http://datavisualization.ch/showcases/
http://www.visualcomplexity.com/vc/
Microsoft Excelデータの読み込み
Excelのデータを読み込むためには、XlsReaderというライブラリを利用します。以下のサイトを開いてください。
http://bezier.de/processing/libs/xls/
zipフォーマットのファイルをダウンロードして解凍してください。
http://bezier.de/processing/libs/xls/#download
フォルダ名が「XlsReader-0.1.1」になっているので、「XlsReader」に変更してからProcessingフォルダ(通常は書類フォルダの中)のLibrariesフォルダの中に入れてください。例えば以下のようなディレクトリになります。

次に、「examples」フォルダの中の「xlsreader_simple1」を開いて実行してみましょう。ライブラリが認識されていればプログラムが実行され、コンソール(コーディング画面の下)に、
noch ein test
233
0.33
と表示されるはずです。ウィンドウには何も表示されませんが、ExcelのデータProcessingに読み込まれていることが確認できます。このコードを見ていきましょう。
xlsreader_simple1
import de.bezier.data.*;

XlsReader reader;


void setup ()
{
    reader = new XlsReader( this, "workbook.xls" );    //ファイル名を指定して読み込む(Excelシートはdataフォルダの中に入れる)

    println( reader.getString( 1, 0 ) );    // 1つ目の値は行、2つ目の値は列。どちらも0から始まる(0行目と0列目)ことに注意。
    println( reader.getInt( 2, 0 ) );
    println( reader.getFloat( 3, 0 ) );
}
xlsreader_simple2
import de.bezier.data.*;

XlsReader reader;


void setup ()
{
    reader = new XlsReader( this, "workbook.xls" );    //ファイル名を指定して読み込む(Excelシートはdataフォルダの中に入れる)

    reader.firstRow();               //最初の行に移動する(データが入っていない行は無視する)
                                     //そして最初のセルを選ぶ
    println( reader.getString() );   //データを読み込む

    reader.nextCell();   //右隣のセルを選択
    println(reader.getString());

    reader.nextRow();                //次の行と最初のセルを選ぶ
    println( reader.getInt() );

    reader.nextRow();
    println( reader.getFloat() );
}
次に、データが複数のページに渡っている場合に、ページを移動するためのサンプルです。
xlsreader_simple3
import de.bezier.data.*;

XlsReader reader;

void setup ()
{
    reader = new XlsReader( this, "Arbeitsmappe1.xls" );  //Excelファイルを開く

    reader.firstRow();              //最初の行に移動する(データが入っていない行は無視する)
    println( reader.getString() );  //最初のページのデータを読み込む

    reader.openSheet(1);            //次のページに行く
    reader.firstRow();              //最初の行に移動する(データが入っていない行は無視する)
    println( reader.getString() );  //
}
自身でプログラムを書くときのExcelファイルの保存
自身で新しくプログラムを書く場合には、以下の画像のように必ずProcessingのファイルがあるフォルダ内に「data」フォルダを作って、その中にExcelシートを保存してください。
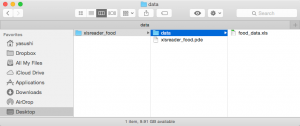
現行のExcelの標準ファイル形式である「.xlsx」には対応していないようなので、必ずExcel 97-2004ブックの「.xls」形式にしてください。
ちなみに、XlsReaderは更新されていないので、今後も.xlsx形式には対応しないと思います。
簡単な視覚化をおこなってみる
次は、日本人の二人以上の世帯における一世帯当たりの一ヶ月の支出を食品について抜きだして割合を色分けしたものです。
以下のサイトから2011年度のファイルをダウンロードしてください。
http://www.e-stat.go.jp/SG1/estat/List.do?lid=000001088844
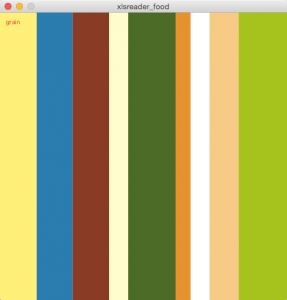
xlsreader_food
import de.bezier.data.*;

XlsReader reader;

PFont myFont;    //フォント用変数
float grain, fish, meat, dairy, vege, fruit, oil, sweets, processing;
float total;

size( 500, 500 );

noStroke();
fill( 0 );
background( 255 );
smooth();

myFont = createFont("HiraKakuPro-W3", 12);    //フォント作成
textFont(myFont, 10);  //テキストのサイズを設定

//以下のサイトからダウンロード
//http://www.e-stat.go.jp/SG1/estat/List.do?lid=000001088844
reader = new XlsReader( this, "food_data.xls" );  //ファイル読み込み

grain = (float)reader.getInt(72, 15);	//穀物
fish = (float)reader.getInt(77, 15);	//魚
meat = (float)reader.getInt(82, 15);	//肉
dairy = (float)reader.getInt(85, 15);	//乳製品
vege = (float)reader.getInt(89, 15);	//野菜
fruit = (float)reader.getInt(94, 15);	//果物
oil = (float)reader.getInt(97, 15);	//油脂類
sweets = (float)reader.getInt(100, 15);	//菓子
processing = (float)reader.getInt(101, 15);	//加工品

//全ての合計
total = grain + fish + meat + dairy + vege + fruit + oil + sweets +
      processing;

grain = grain/total*(float)width;  //grain(穀類)の全体に対する割合を計算
fill(255, 245, 113);  //好きな色を付ける
rect(0, 0, grain, height);
fill(255, 0, 0);  //項目をテキスト表示
text("grain", 10, 20);

fish = fish/total*(float)width;
fill(0, 124, 178);
rect(grain, 0, fish, height);

meat = meat/total*(float)width;
fill(147, 47, 27);
rect(grain + fish, 0, meat, height);

dairy = dairy/total*(float)width;
fill(255, 255, 204);
rect(grain + fish + meat, 0, dairy, height);

vege = vege/total*(float)width;
fill(62, 113, 36);
rect(grain + fish + meat + dairy, 0, vege, height);

fruit = fruit/total*(float)width;
fill(241, 141, 0);
rect(grain + fish + meat + dairy + vege, 0, fruit, height);

oil = oil/total*(float)width;
fill(255, 255, 255);
rect(grain + fish + meat + dairy + vege +fruit, 0, oil, height);

sweets = sweets/total*(float)width;
fill(251, 204, 126);
rect(grain + fish + meat + dairy + vege +fruit +oil, 0, sweets, height);

processing = processing/total*(float)width;
fill(153, 204, 0);
rect(grain + fish + meat + dairy + vege +fruit +oil + sweets, 0, processing, height);
次はもう少し複雑になります。全国の県庁所在地の位置情報をProcessingに自動的に取り込んで地名を表示します。
以下のURLからデータをダウンロードしてください。
//http://www.benricho.org/chimei/latlng_data.html
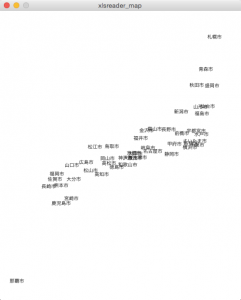
xlsreader_map
import de.bezier.data.*;

XlsReader reader;

PFont myFont;    //フォント用変数
float myScale = 30.0;    //拡大率
float x, y;    //x, y座標

size( 500, 600 );

noStroke();
fill( 0 );
background( 255 );
smooth();

myFont = createFont("HiraKakuPro-W3", 12);    //フォント作成
textFont(myFont, 10);  //テキストのサイズを設定

//http://www.benricho.org/chimei/latlng_data.html
reader = new XlsReader( this, "latlng_data.xls" );  //

//for文は開始行から最後の行までを指定する。
//この場合、最後の6行は関係ないテキストなので、getLastRowNum()で最後の行を検索してそこから6行引く。
for (int i = 5; i <= reader.getLastRowNum() - 6 ; i ++)
{
  //経度を抜き出す。沖縄の経度が127度ぐらいなので、全体の経度から127度を引けば、ほぼ0度〜11.4度ぐらいの間に収まる
  x = (reader.getFloat(i, 5) - 127) * myScale;
  //緯度を抜き出す。沖縄の緯度が26度ぐらいなので、 全体の緯度から25度を引けば、ほぼ1度〜11.6度ぐらいの間に収まる
  y = (float)height - (reader.getFloat(i, 4) - 25) * myScale;

  text(reader.getString(i, 2), x, y);  //度道府県の県庁所在地の地名を、x, y座標上に表示

  //Excelのデータを表示
  print( reader.getString(i, 2) + " "
    + reader.getFloat(i, 4) + " "
    + reader.getFloat(i, 5) + "\n");    //
}
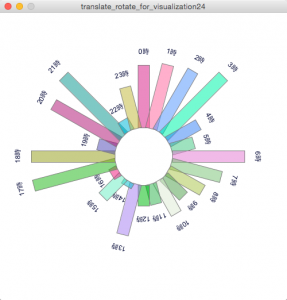
次のサンプルでは、1日を24時間にして1時間当たりの情報を時計回りに描画していくサンプルを考えてみます。このサンプルではExcelシートは使わないので、データの生成はランダムにしています。
以下のコードは、座標系の変換(translate, rotate)を使っているので、それらの知識があることが前提です。初めての方は以下のレジュメで勉強してみてください。
translate, rotate, scale
int[] boxH = new int[24];  //24時間分の情報を格納する配列
PFont myFont;    //フォント用変数

size(500, 500);
rectMode(CENTER);
noFill();
stroke(0);
smooth();
background(255);

myFont = createFont("Arial", 12);    //フォント作成
textFont(myFont, 12);  //テキストのサイズを設定
textAlign(CENTER);

for (int i = 0; i < 24; i ++) {

  //このプログラムでは、4角形の高さ情報はランダムに決める
  boxH[i] = (int)random(10, 150);

  pushMatrix();
  translate(width/2, height/2);

  // 24/360は15なので、15度ずつ座標系を回転する
  rotate(radians(i*15));

  //stroke(200);
  //for (int x = 0; x <= width; x += 10) line(x, 0, x, height);
  //for (int y = 0; y <= height; y += 10) line(0, y, width, y);

  stroke(127);
  fill(random(255), random(255), random(255), 127);  //ここでは色彩もランダム
  rect(0, - 50 - boxH[i]/2, 20, boxH[i]);  //4角形を描画する

  fill(0, 0, 50);
  text(i + "時", 0, - 50 - boxH[i] - 20);  //時間を描画

  popMatrix();
}
こうしてみると、バーの高さの情報および色という、2種類の情報を扱うことができます。
さて、次にはもう少し有用性のあるデータを使ってみます。これも、上記のサンプルと同じように円状に棒グラフを並べたものですが、ここでは東京都の年間の1日ごとの平均風速と平均気温のデータを使っています。
データは気象庁のサイトからダウンロードしました。
気象情報データダウンロードサイト
実際に使ったデータはこちら。
data.xls
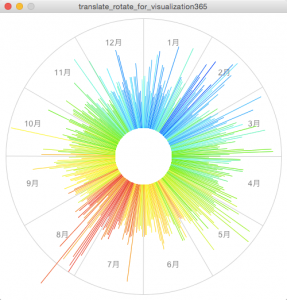
//東京の、2014年における1日ごとの平均気温平均の風速を視覚化した
//平均気温は色、風速は棒の長さで表している
//作成:野口靖

import de.bezier.data.*;

XlsReader reader;
float[] wind = new float[365];  //風速用の配列
float[] temperature = new float[365];  //気温用の配列
PFont myFont;    //フォント用変数
float x1, y1, x2, y2;  //月ごとの分割用の線を描画するための変数
int month;

size(500, 500);
colorMode(HSB, 360, 100, 100);  //色彩の表示方法をHSBに変更
textAlign(CENTER);
smooth();
background(0, 0, 100);  //背景は白

myFont = createFont("Arial", 12);    //フォント作成
textFont(myFont, 14);  //テキストのサイズを設定
textAlign(CENTER);

reader = new XlsReader( this, "data.xls" );  //Excelファイルを読み込み

stroke(0, 0, 80);
ellipse(width/2, height/2, 480, 480);  //外側の円

//月ごとの分割線を描画。1ヶ月ごとにグレーの線を描いていく///////////////
//文字を表示するときにrotateを使うと、文字も回転してしまうので、ここではsin, cosを使っている。

for (int i = 0; i < 12; i ++) {

  x1 = 50*cos(radians(i*30));  //30度ごとのグレーの線の内側の点を求める
  y1 = 50*sin(radians(i*30));

  x2 = 240*cos(radians(i*30));  //30度ごとのグレーの線の外側の点を求める
  y2 = 240*sin(radians(i*30));

  line(width/2 + x1, height/2 + y1, width/2 + x2, height/2 + y2);  //線を描画

  //月をテキストで書く。一番上から時計回りで始めるため、90度引く。さらに、15度移動すれば、
  //グレーの線の間に表示することができる
  x1 = 200*cos(radians(i*30 + 15 - 90));
  y1 = 200*sin(radians(i*30 + 15 - 90));

  month = i + 1;  //月は、i + 1で1月から始まる
  fill(0, 0, 50);
  text(month + "月", width/2 + x1, height/2 + y1);  //月を描画
}

//気温と風速を描画////////////////////////////////////////

//365日分の1日は、角度にすると360度分の何度になるかを計算 = 0.986.....
float angle = 360.0 / 365.0;

//1日ごとに描画
for (int i = 0; i < 365; i ++) {

  //風速の最大値が7.3なので、32をかけると233.6になって画面内に収まる
  //全体的にもっと短くしたければ、32をもっと小さい値ににすればいい
  wind[i] = reader.getFloat(i + 5, 4) * 32.0;

  //ステップ1。気温の最大値が31.1なので、まず抽出した値の最大値に対しての割合を計算する(0.0〜1.0)
  float temp = reader.getFloat(i + 5, 1) / 31.1;

  //ステップ2。気温が高い場合に赤(HSBの色相で0)、低いと青(HSBの色相で240)にしたいので、1.0からtempを引く
  //最高気温が0.0、0度が1.0になる
  temp = 1.0 - temp;

  //ステップ3。最後に240かけると、最高気温が0、0度が240になる。これを色相の値にする
  temperature[i] = temp * 240.0;

  //ステップ1〜3は、もっと短く書くと以下の式になる
  //temperature[i] = (1.0 - (reader.getFloat(i + 5, 1) / 31.1)) * 240.0;

  pushMatrix();
  translate(width/2, height/2);  //画面中央に座標系を移動
  rotate(radians(i*angle));  //1日分ずつ座標系を回転

  stroke(temperature[i], 100, 100);  //上記の色相の値を線の色に変換
  line(0, -50, 0, -50 - wind[i]);  //線を描画
  popMatrix();
}
以下のサイトに利用できる関数の一覧があります。この実習で紹介していない便利な関数もあるので、一度調べてみるといいでしょう。
http://bezier.de/processing/libs/xls/documentation/index.html
Pingback: Processing(Proce55ing)をつかうときの参考資料 | おにぎりまとめ